File Structure
Introduction
This document describes the specifications of the data and metadata fields required for submitting datasets to the Simons CMAP database. The submitted data can be in any file format such as netCDF, parquet, plain text, CSV, or Excel files. The only requirement is that information for all required fields (specified by * ) is provided. For simplicity, we have created an empty dataset template in Excel format that can be found here. You can use this template to load and submit your dataset. The data and metadata field names (e.g. time, lat, lon, short_name, long_name, ...) used in the template file are based on the CF and COARDS naming conventions [1, 2, 3].The CMAP data template consists of three sheets: data, dataset metadata, and variable metadata. Data is stored in the first sheet called “data”. Metadata that describes the dataset is entered in the second sheet called “dataset_meta_data”. Metadata associated with the variables in the dataset are entered in the third sheet called “vars_meta_data”. Information must be provided for all columns except those specifcally noted as optional. For those datasets that use the Excel template, a web-based tool is available through Simons CMAP to validate and modify a given dataset to ensure it conforms to structure requirements for dataset submission. Below are a few example datasets that have been prepared using the specifications described in this document:
Data Sheet
| time | lat | lon | depth [if exists] | var1 | ... | varn |
|---|---|---|---|---|---|---|
| example: 2016-5-01T15:02:00 | 25 | -158 | 5 | value | ... | value |
All data points are stored in the “Data” sheet. Each data point must have time and location information. The exact name and order of the time and location columns are shown in the table above. If a dataset does not have depth values (e.g., sea surface measurements), you may remove the depth column. If your dataset represents results of a Laboratory study (see dataset_make) fill these fields with the time of study and the location of your laboratory. The columns var1 … varn represent the dataset variables (measurements). Please rename var1 … varn to names appropriate to your data. The format of “time”, “lat”, “lon”, and “depth” columns are described in the following sections. Please review the example datasets listed in the introduction for more detailed information.
- time*
This column holds datetime values with the following format: %Y-%m-%dT%H:%M:%S
The date and time sections are separated by a “T” character.
Example: 2010-02-09T18:15:00- Year (%Y) is a four-digit value: example 2010
- Month (%m) is a two-digit value: example 02 (for Feburary)
- Day (%d) is a two-digit value: example 09
- Hour (%H) is a two-digit value from 00 to 23: example 18
- Minute (%M) is a two-digit value from 00 to 59: example 15
- Second (%S) is a two-digit value from 00 to 59: example 00
- Time zone: UTC
- lat*
This column holds the latitude values with the following characteristics:- Type: Numeric values from -90 to 90
- Format: Decimal (not military grid system)
- Unit: degree North
- lon*
This column holds the longitude values with the following characteristics:- Type: Numeric values from -180 to 180
- Format: Decimal (not military grid system)
- Unit: degree East
- depth
This column holds the depth values with the following characteristics:- Type: Positive numeric values. It is 0 at surface with increased values with depth.
- Format: Decimal
- Unit: meter
- var1 … varn
These columns represent the dataset variables (measurements). Please rename them to names appropriate for your data. Note that these names should be identical to the names defined as var_short_name in the Variable Metadata sheet. Please do not include units in these columns; units are recorded in the Variable Metadata sheet. Leave a given cell empty for those instances when data was not taken and a value is missing. Do not replace the missing data with arbitrary values such as “99999”, “0”, “UNKNOWN”, etc. Please review the example datasets listed in the introduction for more information.
Dataset Metadata
This sheet holds a list of top-level attributes about the dataset such as the dataset name and description. Below are the list of these attributes along with their descriptions. Please review the example datasets listed in the introduction for more information.- dataset_short_name*
This name is meant to be used in programming codes and scripts. It should only contain a combination of letters, numbers, and underscores (the first character can not be a number). Do not use space, dash, or special characters such as <, +, %, etc. The name must be shorter than 50 characters and is a required field.- Required: Yes
- Constraint: Less than 50 characters
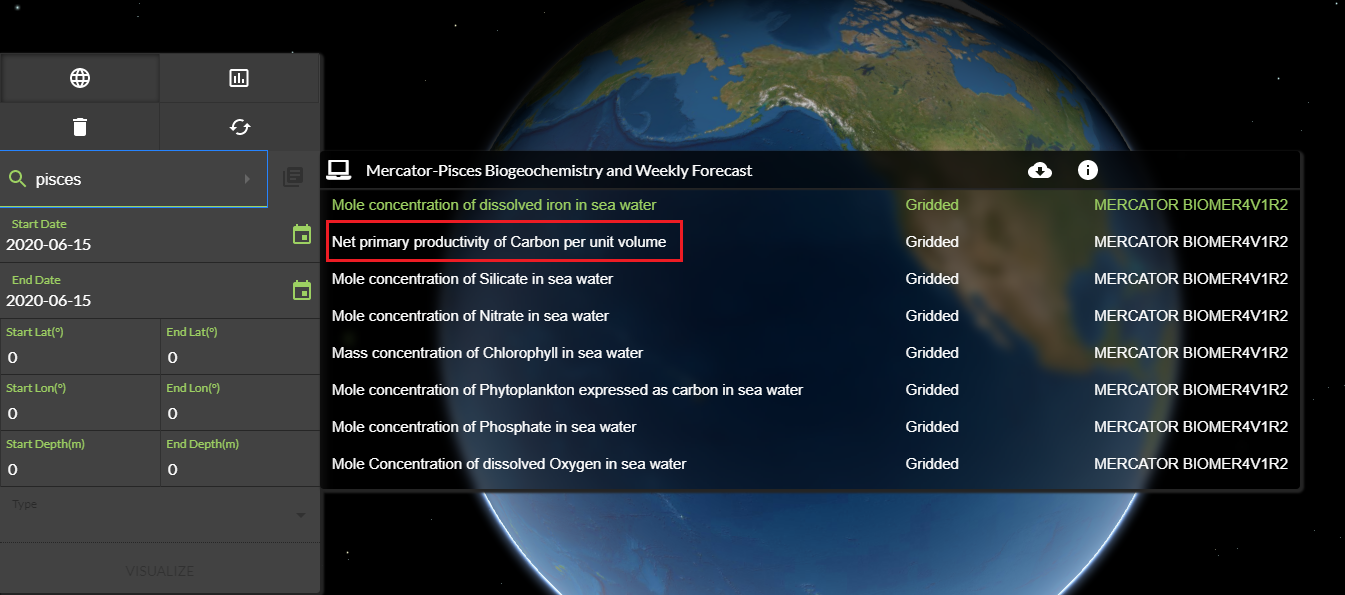
- dataset_long_name*
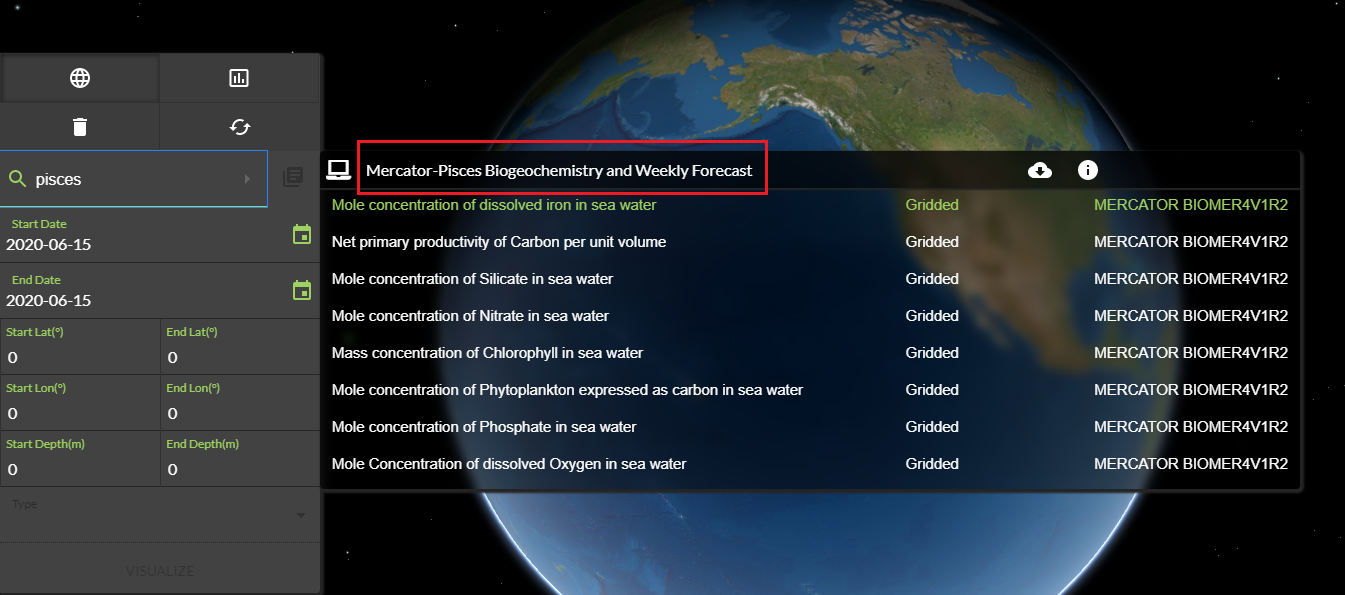
A descriptive and human-readable name for the dataset. This name will identify your dataset in the CMAP catalog (Fig.1) and visualization search dialog (Fig.2). Any Unicode character can be used here, but please avoid names longer than 200 characters as they may get trimmed when displayed on graphical interfaces. A full textual description of your dataset, with no length limits, is entered in “dataset_description” . If your dataset is associated with a cruise, we recommend including the official cruise and and the cruise nickname in the dataset_long_name. For example: Underway CTD Gradients 3 KM1906.- Required: Yes
- Constraint: Less than 200 characters

- dataset_version*
Please assign a version number or an identifier to your dataset such as “1.0.0” or “Final”. Version identifiers will help track the evolution of a dataset over time.- Required: Yes
- Constraint: Less than 50 characters
- Example: 1.0
- dataset_release_date*
Indicates the release date of the dataset. If your dataset has been previously published or released publicly, please specify that date. Otherwise, use the date the dataset was submitted to CMAP.- Required: Yes
- Constraint: Less than 50 characters
- Example: 2020-06-22
- dataset_make*
This is a required field that provides a broad category description of how a dataset was produced (also referred to asdataset make). Each dataset requires a single descriptor from a fixed set of options (observation, model, assimilation, laboratory), which are described below. This field will help in discovery of data in CMAP by categorizing datasets according to theirMakeclass. Please contact us if you believe your dataset Make is not consistent with any of the categories below:- Observation: refers to any in-situ or remote sensing measurements such as measurements made during a cruise expedition, data from an in-situ sensor, or satellite observations. Observations made as part of laboratory experiments have their own distinct category and do not fall in this category.
- Model: refers to the outputs of numerical simulations.
- Assimilation: refers to products that are a blend of observations and numerical models.
- Laboratory: refers to the observations made in a laboratory setting such as culture experiment results.
- dataset_source*
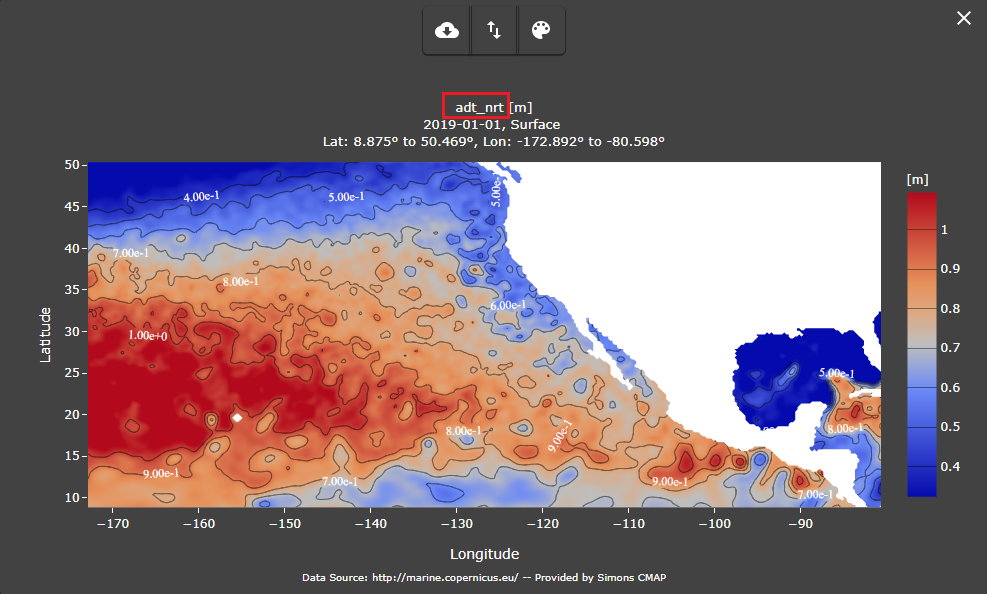
Specifies the group and/or the institute name of the data owner(s). It can also include any link (such as a website) to the data producers. This information will be visible in the CMAP catalog as shown in Fig.3. Also, dataset_source will be annotated to any visualization made using the dataset (Fig. 4). This is a required field and its length must be less than 100 characters.- Required: Yes
- Constraint: Less than 100 characters
- Example: Armbrust Lab, University of Washington


- dataset_distributor
If your dataset has already been published by a data distributor provide a link to the data distributor. Otherwise, leave this field empty. This is not a required field.- Required: No (optional)
- Constraint: Less than 100 characters
- Example: http://marine.copernicus.eu/
- dataset_acknowledgement
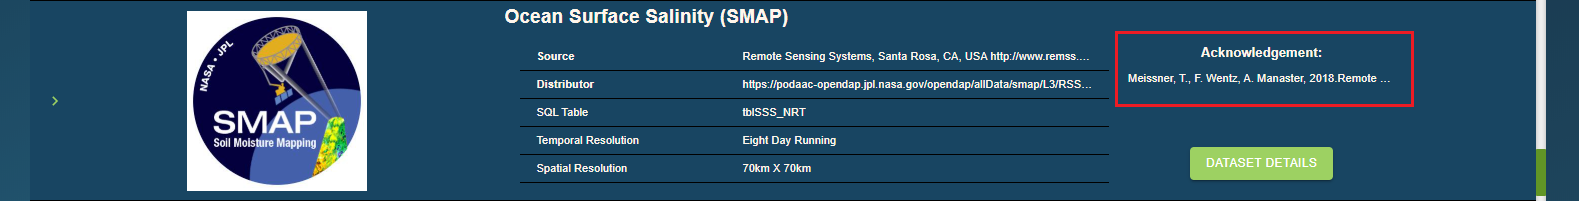
Specify how your dataset should be acknowleged. You may mention your funding agency, grant number, or you may ask those that use your data to acknowledge your dataset with a particular statement. Dataset acknowlegment will be visible in the catalog page (Fig. 5). This is not a required field.- Required: No (optional)
- Constraint: No length limits
- dataset_history
Use this field if your dataset has evolved over time and you wish to add notes about the history of your dataset. Otherwise, leave this field empty. This is not a required field.
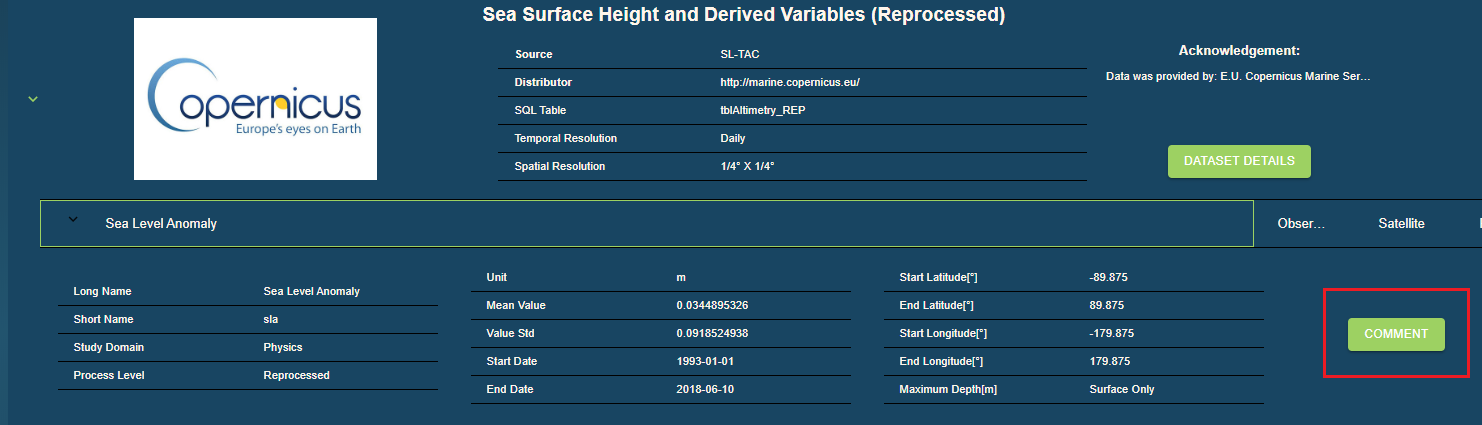
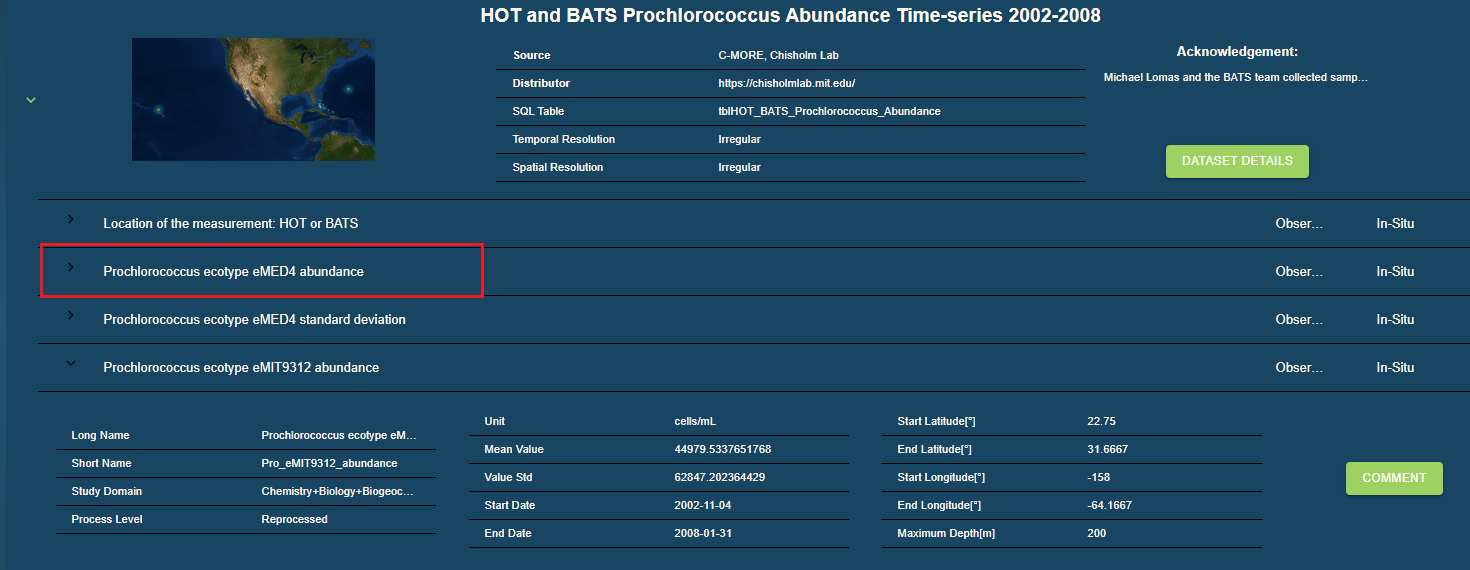
- dataset_description*
Include any description that you think will help a reader better understand your dataset. This description can include information about data acquisition, processing methods, figures, and links to external content. This field serves as the dataset documentation that is visible in the Simons CMAP catalog (Fig. 6). This field is required.- Required: Yes
- Constraint: No length limits

- dataset_references
List any publications or documentation that one may cite in reference to the dataset. If there are more than one reference, please put them in separate cells under the dataset_reference column. Leave this field empty if there are no publications associated with this dataset. This is not a required field.
- climatology
This is a flag indicating whether the dataset represents a climatological product. If your dataset is a climatological product fill this field with “1”. Otherwise, leave this field blank. This is not a required field.
- cruise_names
If your dataset represents measurements made during a cruise expedition (or expeditions), provide a list of cruise official names here. If your dataset is associated with more than one cruise, please put them in separate cells under the cruise_names column. If the cruises have any nicknames, please include them in the same cell as the official cruise name separated by a comma(s). Leave this field blank if your dataset is not associated with a cruise expedition. This is not a required field.- Required: No (optional)
- Constraint: No length limits
- Example: KOK1606, Gradients 1
Variable Metadata
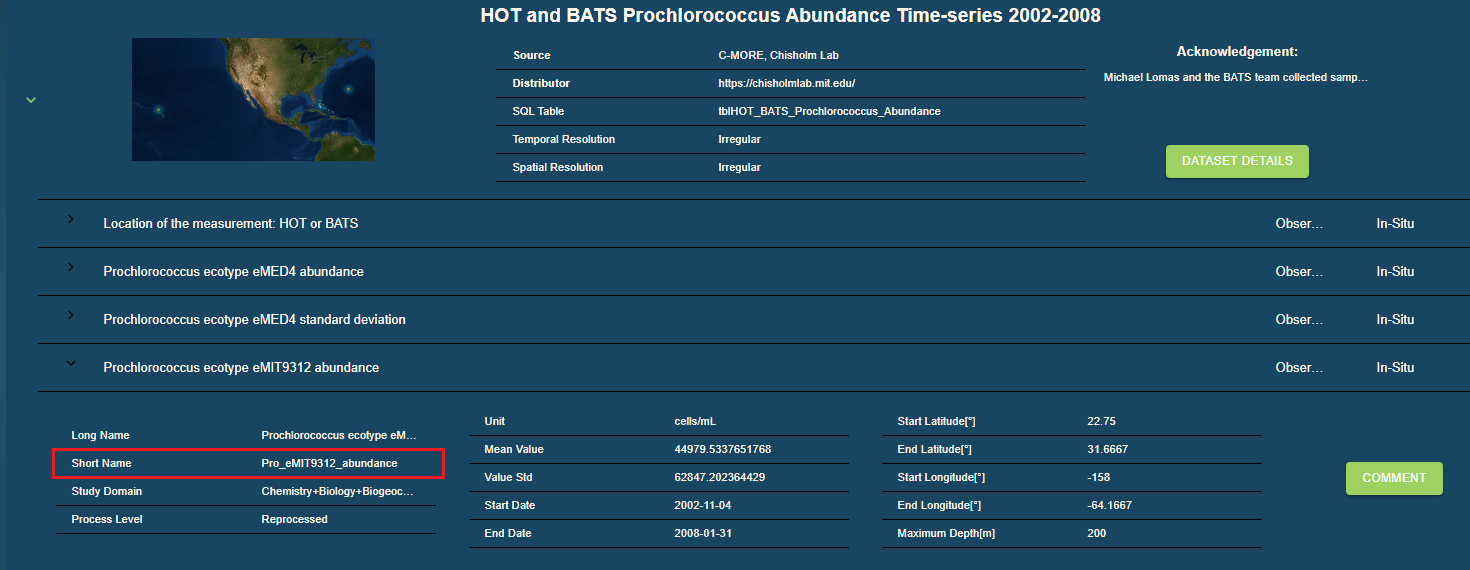
A dataset can contain multiple different measurements (variables). This sheet (labeled as "vars_meta_data") holds a list of top-level attributes about these variables such as the variable name, unit, and description. Each variable along with its attributes (metadata) is stored in separate rows. Below is the list of these attributes along with their descriptions. Please review the example datasets listed in the introduction for more information.- var_short_name*
This name is meant to be used in programming codes and scripts. It should only contain a combination of letters, numbers, and underscores (the first character can not be a number). Do not use space, dash, or special characters such as <, +, %, etc. Finally, there must be a one-to-one match between the short_names listed here and the variable column names in the “Data” sheet (see vars).var_short_namewill be seen in the CMAP catalog (Fig. 7), and will appear as the title of the generated figures (Fig. 8). This a required field and must be shorter than 50 characters.- Required: Yes
- Constraint: Less than 50 characters
- var_long_name*
A descriptive and human-readable label for the variable in accordance with the CF and COARDS conventions [1, 2, 3]. This name will present your variable in the CMAP catalog (Fig. 9) and visualization search dialog (Fig. 10).var_long_namecan contain any unicode character, but please avoid names longer than 200 characters as they may get trimmed while displayed on graphical interfaces. Please use var_comment if you would like to add a full textual description (with no length limits) for your variable.- Required: Yes
- Constraint: Less than 200 characters
- var_sensor*
This is a required field that refers to the instrument used to produce the measurements such asCTD,fluorometer,flow cytometer,sediment trap, etc. If your dataset is the result of a field expedition but you are not sure about the name of the instrument used for the measurements, use the term “in-situ” to fill out this field. If your dataset is the output of a numerical model or a combination of model and observation, use the term “simulation” and “blend”, respectively. This field will significantly help to find and categorize data generated using a similar class of instruments.var_sensorwill be visible in the Simons CMAP catalog.
- var_unit
Specifies variable units, if applicable. Leave this field blank if your variable is unitless (e.g. “station numbers” or “quality flags”). Units may contain unicode characters such as subscripts and superscripts.var_unitwill be visible in the Simons CMAP catalog (see Fig. 9) and in the generated visualizations (see Fig. 8). This field is not required.- Required: No (optional)
- Constraint: Less than 50 characters
- Example: ug L-1
- var_spatial_res*
Specifies the spatial resolution of the variable. Typically, gridded products have uniform spatial spacing (such as 0.25° X 0.25°) while field expeditions do not have a regular spatial resolution. If your variable does not have a regular spatial resolution, use the term “irregular” to fill out this field. Note that if samples are taken at a series of distinct but spatially-non-uniform stations, the spatial resolution is considered irregular.var_spatial_resmay contain unicode characters such as degree symbol ( ° ) and will be visible in the Simons CMAP catalog (see Fig. 9). This field is required.- Required: Yes
- Constraint: Less than 50 characters
- Example: irregular
- var_temporal_res*
Specifies the temporal resolution of measurements (such as daily, hourly, 3-minutes, etc). If the measurements do not have a regular temporal spacing, use the term “irregular” to fill out this field.var_temporal_reswill be visible in the Simons CMAP catalog (see Fig. 9). This field is required.- Required: Yes
- Constraint: Less than 50 characters
- Example: irregular
- var_discipline*
Indicates in which disciplines (such as Physics, Biology …) this variable is commonly studied. You can specify more than one discipline. If you list multiple disciplines per variable, please separate them by comma.var_disciplinewill be visible in the Simons CMAP catalog (referred to as “Study Domain” in Fig. 9). This field is required.- Required: Yes
- Constraint: Less than 100 characters
- Example: Physics, BioGeoChemistry
- visualize
This is a flag field and can only be 0 or 1. Fill this field with 1, if you think this variable can be visualized on a graph by Simons CMAP. In principle, any variable with numeric values can be visualized while variables with string values, station numbers, or quality flags may not be the best candidates for visualization in CMAP. Please consult with the data curation team if you have any questions. This is not a required field.
var_keywords*
Every variable in CMAP is annotated with a range of semantically related keywords to ensure a variable can be easily discovered. For example, use of keywords allows you to search using the term “PO4” and retrieve a list of all phosphate data even if “PO4” was not used as the var_long_name for a given dataset. Similarly, if one searches for “MIT”, CMAP returns all variables generated by MIT groups, or if one looks for “model”, only model outputs are returned. These “semantic” searches are made possible using the keywords that are added to each variable. We would like to have keywords to cover the following areas described below (where applicable). Please note that there is no limit to the number of keywords used for a variable. The keywords are case-insensitive and you may add/remove them at any point (even after data ingestion). This is a required field.- Alternative names: other official, unofficial, abbreviation, technical (or jargon) names or notations associated with the variable.
Examples: Nitrate, NO3, NO_3
- Method and Instrument: Keywords related to the method and instruments used for the variable measurements.
Examples: observation, in-situ, model, satellite, remote sensing, cruise, CTD, cytometry, ….
Note these keywords are not mutually exclusive. For example, a CTD temperature measurement made during a cruise can have all of the following keywords: observation, in-situ, cruise, CTD - Data Producers: Keywords associated with the lead scientist/lab name/institute name.
Examples: UW, University of Washington, Virginia Armbrust, Ginger - Cruise: The official/unoffical name of the cruise(s) during which the variable was measured, if applicable.
Examples: KOK1606, Gradients_1, diel - Project name: If your data are in the context of a project, include the project name.
Examples: HOT, Darwin, SeaFlow
- Alternative names: other official, unofficial, abbreviation, technical (or jargon) names or notations associated with the variable.
- var_comment
Use this field to communicate any detailed information about this particular variable with the users. This could include, for example, description of method(s) used to process the raw measurements.var_commentis visible in the Simons CMAP catalog (Fig. 11). This field is not required.- Required: No (optional)
- Constraint: No length limits